Asset TV Small Cap Video Masterclass with Mark Roach, Nathan Moser and Chris Parker
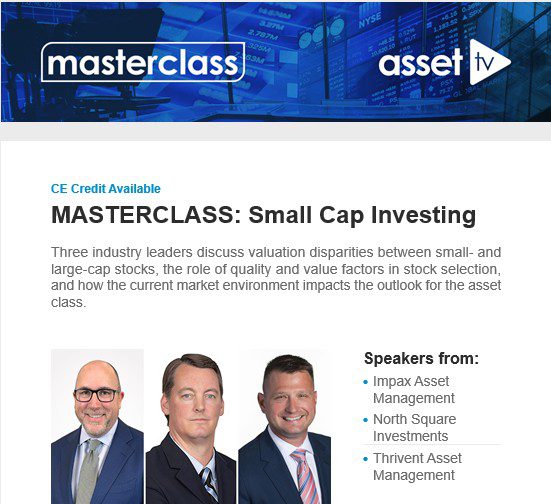
This Asset TV Small Caps Masterclass interview features Mark Roach, director of Small and Micro Cap Equities at CS McKee and lead portfolio manager of the North Square Small Cap Value Fund at North Square Investments, Nathan Moser, senior portfolio manager at Impax Asset Management and Chris Parker, senior portfolio manager of Thrivent Small Cap Value ETF at Thrivent Asset Management. Please visit the Asset TV website to view the full video: https://www.assettv.com
Click here to read the transcript
This video interview was recorded in June, 2026. The opinions expressed herein are those of North Square Investments, LLC (North Square) and are subject to change without notice. The opinions referenced are as of the date of publication/distribution, may be modified due to changes in the market or economic conditions, and may not necessarily come to pass. Forward looking statements cannot be guaranteed. The discussions in our podcasts are for general informational purposes only and should not be considered as investment advice. The inclusion and performance of specific investments discussed represent only a sample of North Square’s Fund investments, and do not represent North Square’s Fund investments or performance as a whole. A complete list of North Square’s holdings is available upon request. There is no guarantee that any investments discussed at the time of this podcast will remain in North Square’s Fund(s). Past performance is not indicative of future results. It should not be assumed that any of the securities or companies discussed have been or will be profitable, or that investment recommendations or decisions we make in the future will be profitable. Nothing discussed herein constitutes an offer or recommendation to buy or sell a particular security or investment strategy. North Square reserves the right to modify its current investment strategies and techniques based on changing market dynamics or client needs. There is no guarantee that North Square’s assessment of investments will be correct. The discussions, outlook, and viewpoints featured are not intended to be investment advice and do not take into account any specific investment objectives or risk tolerance you may have. Some information contained herein derives from third-party sources North Square believes to be reliable; however, accuracy and completeness cannot be guaranteed. Some material discussed represents an assessment of the market environment regarding a specific security or industry at a particular point in time and is not intended to be a forecast of future events or a guarantee of future results. The investment strategy or strategies discussed may not be suitable for all investors. Investors must make their own decisions based on their specific investment objectives and financial circumstances. No assurance, representation, or warranty is made by any person that any of North Square’s assumptions, expectations, objectives and/or goals will be achieved. Nothing contained in the material may be relied upon as a guarantee, promise, assurance, or representation as to the future. This discussion, including any hypothetical illustrations, are intended to form a basis for further discussion with your legal, accounting, and financial advisors. Actual future investment returns, taxes and inflation are unknown. Do not rely upon this report to predict future investment performance. North Square is an investment adviser registered with the U.S. Securities and Exchange Commission. Registration does not imply a certain level of skill or training. More information about the companies’ investment advisory services can be found in their respective form ADV, which are available upon request.
Any securities mentioned are for illustrative purposes only and do not represent all securities purchased, sold, or recommended for clients. Past performance of these securities does not guarantee future results.
Principal Risks of Investing, North Square Small Cap Value Fund: Risk is inherent in all investing, including an investment in the Fund. An investment in the Fund involves risk, including the following principal risks, among others: Market Risk, Equity Risk, Value-Oriented Investment Strategies Risk, Management and Strategy Risk, Small-Cap-Sized Company Risk, Foreign Investment Risk, Valuation Risk, Sector Focus Risk (Financials Sector and Industrials Sector), Preferred Securities Risk, Convertible Securities Risk, Fixed Income Securities Risk, High Portfolio Turnover Risk, Cybersecurity Risk, and Reliance on Technology Risk Summary descriptions of these and other principal risks of investing in the Fund are set forth in the Fund’s prospectus. Before you decide whether to invest in the Fund, carefully consider these risk factors associated with investing in the Fund, which may cause investors to lose money. There can be no assurance that the Fund will achieve its investment objective. An investment in the Fund is not a deposit of a bank and is not insured or guaranteed by the Federal Deposit Insurance Corporation or any other government agency. Please see the Fund’s prospectus for additional risk disclosures.
Earnings growth is not representative of the fund’s future performance.
Diversification does not assure a profit, nor does it protect against a loss.
Definitions of terms used in this podcast:
Earnings growth is the percentage increase in a company’s net income (profit) over a specific period.
The Purchasing Managers’ Index (PMI) is an economic indicator that assesses the business environment by surveying purchasing managers at private-sector companies about their expectations for orders, production, employment, and supplier deliveries.
The price-to-earnings (P/E) ratio measures a company’s share price relative to its earnings per share (EPS). Often referred to as the price or earnings multiple, the P/E ratio helps assess the relative value of a company’s stock.
Free cash flow yield (FCF) is a valuation metric that measures the cash a company generates relative to its share price. Calculated as FCF per share divided by the current share price, it indicates the percentage of an investment that is returned as free cash flow each year. Free cash flow is the cash a company has left over after paying for its operating expenses and capital expenditures—investments in physical assets like property and equipment. It is the true discretionary cash available to pay dividends, reduce debt, or to reinvest in the company.
Enterprise value to EBITDA (more commonly referred to by the acronym EV/EBITDA) is a popular valuation multiple used to determine the fair market value of a company. By contrast to the more widely available P/E ratio (price-earnings ratio) it includes debt as part of the value of the company in the numerator and excludes costs such as the need to replace depreciating plant, interest on debt, and taxes owed from the earnings or denominator.
The S&P 600 (Standard & Poor’s 600) is a stock market index maintained by S&P Dow Jones Indices that tracks the performance of 600 small-sized U.S. companies. Constituents of the Index typically have a market capitalization between $1.2 billion and $8 billion at the time of inclusion
The S&P 500 (Standard & Poor’s 500) is a stock market index weighted by market capitalization that is made up of 500 of the largest public companies in the United States. Covering approximately 80% of the total U.S. equity market value, it is widely considered the premier benchmark for the broader American economy.
A basis point (often called a “bip” or “bps”) is a standard unit of measurement used in finance to express percentage changes in interest rates, bond yields, and investment fees.
The Russell 2000® Index is a stock market index that measures the performance of approximately 2,000 small-cap U.S. companies. The Russell 2000 represents the smallest two-thirds of the broader Russell 3000 Index and serves as a primary benchmark for tracking the health of smaller, domestically-focused American businesses.
The Russell 2000® Value Index is a prominent U.S. stock market index that tracks the performance of 2,000 smaller companies in the broader Russell 3000 Index, offering a comprehensive view of the small-cap sector. It is not possible to invest directly in an index.
The Russell 3000® Total Return Index, the Fund’s primary regulatory benchmark index, measures the performance of the 3,000 largest U.S. companies based on total market capitalization, which represents approximately 98% of the investable U.S. equities.
Value Momentum Quality (VMQ) is a factor-based quantitative strategy combining three primary investment styles in an effort to identify market-beating stocks.
Active Share measures how much a mutual fund’s portfolio deviates from its benchmark index. High Active Share indicates divergent holdings from the benchmark, suggesting active management.
Alpha represents the excess return of an investment strategy compared to its benchmark index, after accounting for risk.
The margin of safety is a tenet of investing by which an investor purchases securities only if they’re trading below their intrinsic values by a certain amount.
a “K-shaped economy” in which higher-income households experience faster growth in spending than lower-income households.
Beta is an indicator of the price volatility of a stock or other asset in comparison with the broader market. Beta suggests the level of risk that an investor takes on in buying the stock. The higher the beta number, the higher the risk.
A “Small Cap Quality Index” such as is a financial benchmark designed to track smaller companies that exhibit strong fundamentals, robust balance sheets, and consistent profitability, rather than just market size. A classic example is considered to be the MSCI USA Small-Cap Quality Index. This index tracks US companies with market values below a few billion dollars that meet strict “quality” metrics: low debt-to-equity, consistently high returns on equity (ROE), and stable year-over-year earnings
The Downside Capture Ratio measures how well an investment manager performs relative to a benchmark index during periods of market decline. A ratio below 100 indicates the manager outperformed the index during downturns.
The Magnificent Seven (“Mag Seven”) stocks are a group of high-performing and influential companies in the U.S. stock market: Alphabet, Amazon, Apple, Tesla, Meta Platforms, Microsoft, and NVIDIA.
Before investing, carefully consider the product’s investment objectives, risks, charges and expenses. This and other information is in the prospectus, a copy of which may be obtained by calling 855-551-5521. Please read the prospectus carefully before you invest.
Distributed by Foreside Fund Services, LLC. Member FINRA.
North Square Investments, LLC is an investment adviser registered with the U.S. Securities and Exchange Commission. Registration does not imply a certain level of skill or training. More information about the companies’ investment advisory services can be found in their respective form ADV, which are available upon request. Past performance is not indicative of future results. The investment strategy or strategies discussed may not be suitable for all investors. Investors must make their own decisions based on their specific investment objectives and financial circumstances. Nothing discussed herein constitutes and offer to buy or sell a particular security or investment strategy. No assurance, representation, or warranty is made by any person that any of North Square’s assumptions, expectations, objectives and/or goals will be achieved, Nothing contained in the material may be relied upon as a guarantee, promise, assurance, or representation as to the future.